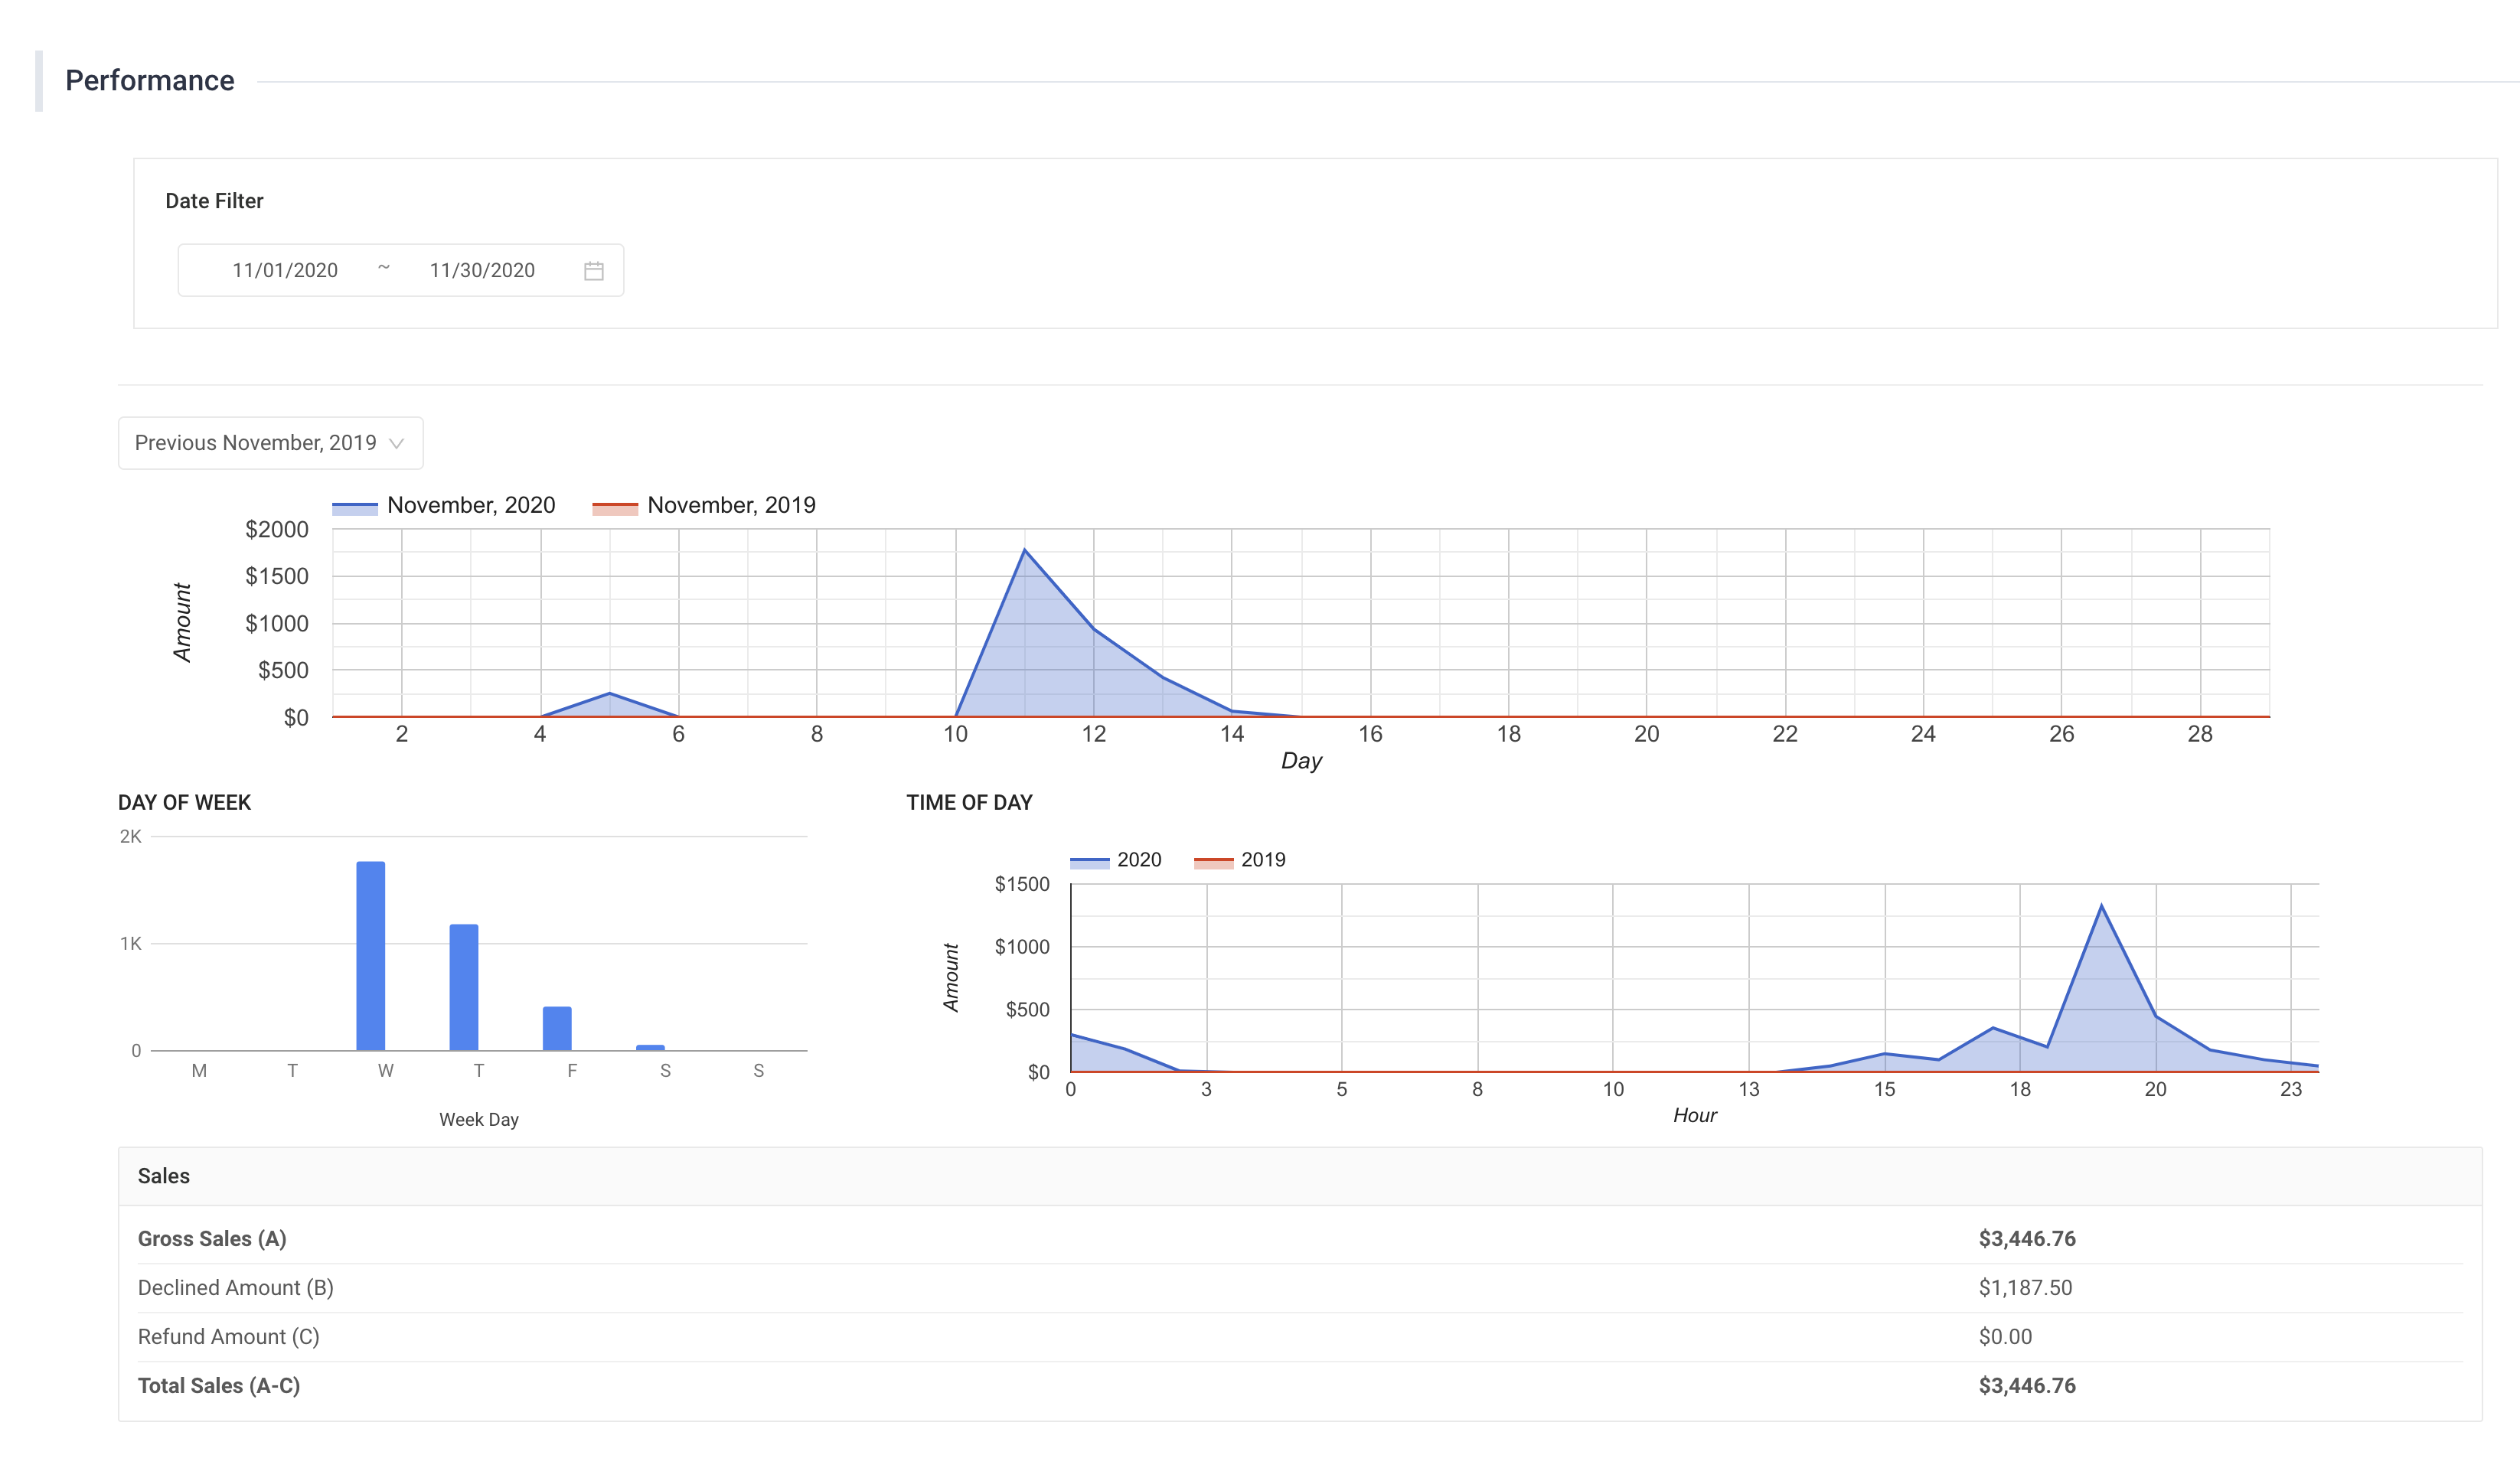
This will show your processing history in comparison to last year, processing volume each day of the week and hour of the day. You can place your mouse pointer on the graph lines to get exact data for the period on the timeline.
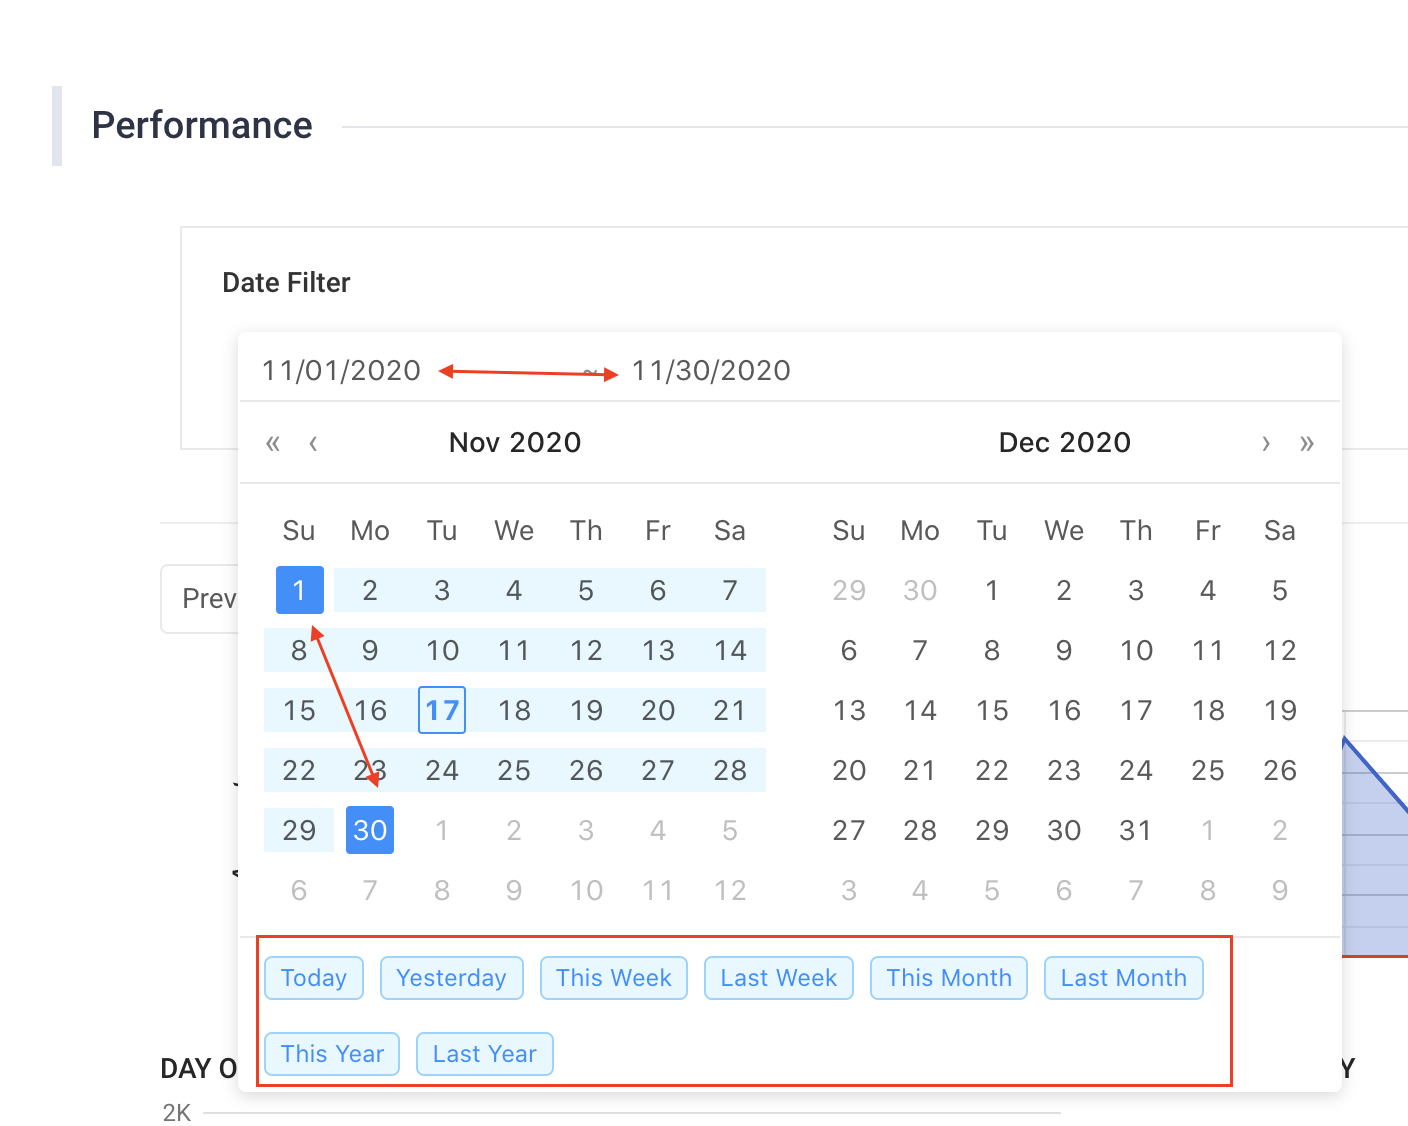
In the date filter section you can look at a date rage. At the bottom of the date module you can click on handy buttons that will allow you to quickly see a week, a month, a year or last year.
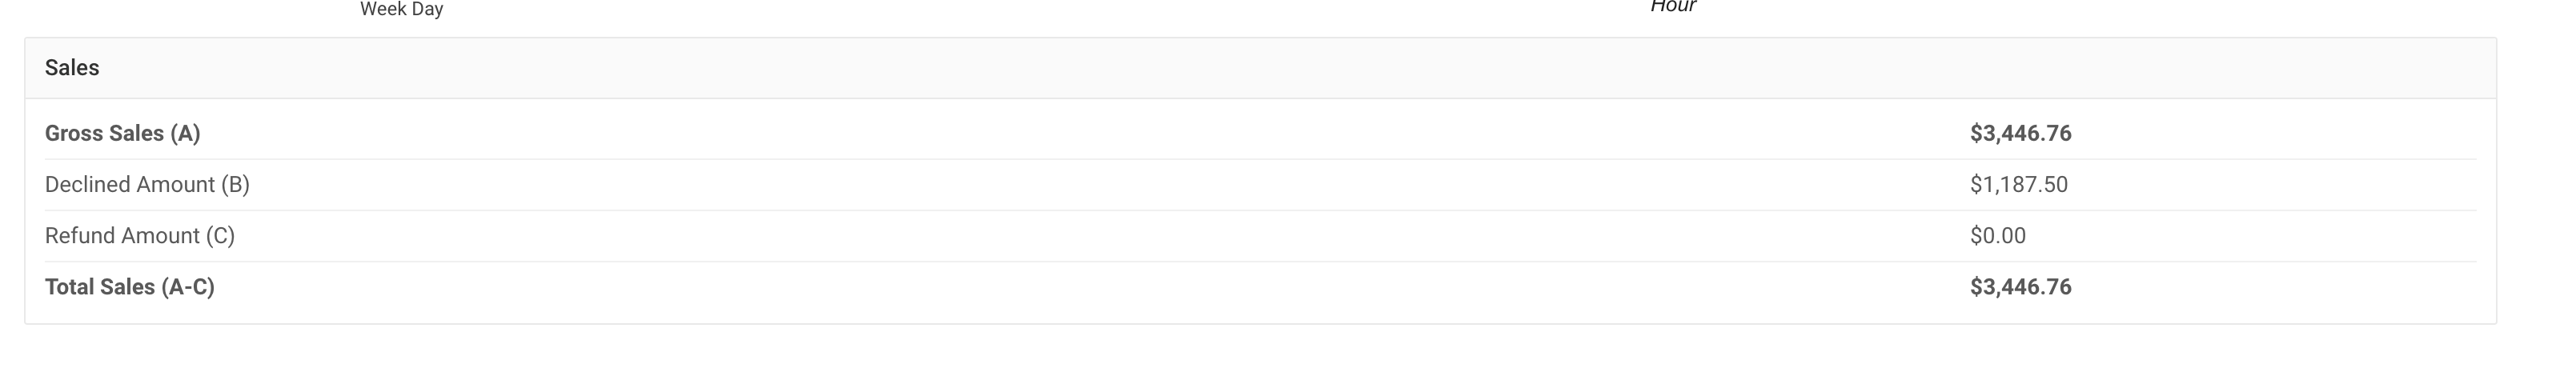
At the bottom of the report, you have access to Gross Sales, Declined Amounts, Refund Amounts, and Total of All the above.